Passengers pay first for the fare and then for selected onboard services.
Live route status · Lucknow · current hubYou’re reading · Cordelia Cruises
ORGANISATION FIELD BRIEF
FIELD EDITIONCordelia Cruises
Cruise operations, hospitality and onboard retail
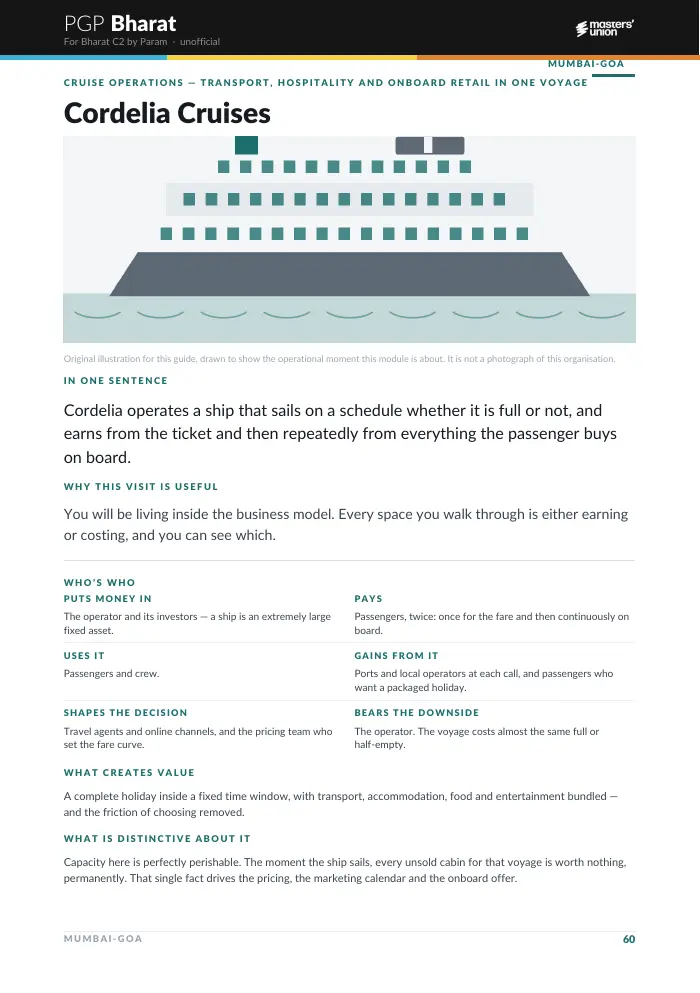
Cordelia operates a ship that sails on schedule whether full or not, earning from both the ticket and what each passenger buys once onboard.
WHY THIS VISIT IS USEFUL
It combines transport, hotel operations, food, retail and entertainment inside one fixed departure window.
WHAT IT CANNOT ESTABLISH
One sailing cannot establish route economics, seasonality or whether discounting has trained customer behaviour.THE SYSTEM MODEL
Who acts, who pays and who carries the downside?
Passengers and crew; ports and local operators also benefit.
Travel channels and the revenue team shaping the fare curve.
The operator bears almost the same voyage cost whether the ship is full or half-empty.
Cabin-night, meals, entertainment and purchases at sea.
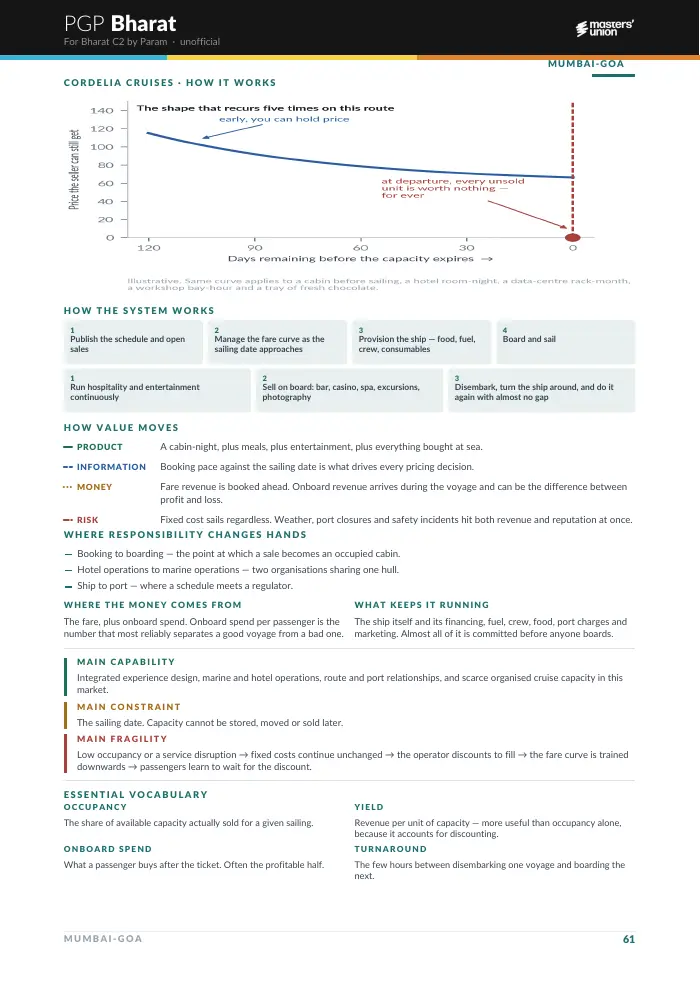
Booking pace against sailing date drives pricing and provisioning.
Fare arrives ahead; onboard spend arrives during the voyage and may decide profit.
Fixed cost sails regardless; weather, port and safety events hit revenue and reputation.
Integrated experience design, marine and hotel operations, and route/port relationships.
The sailing date. Capacity cannot be stored or sold later.
Low occupancy → fixed cost continues → discounting fills cabins → customers learn to wait → the fare curve weakens.
ON THE GROUND
Look for evidence—not presentation polish.
What to notice
- Where passengers queue during turnaround
- Which activities create onboard spend
- How hotel and marine teams coordinate
Numbers that reveal the system
- Occupancy by fare band
- Onboard spend per passenger
- Turnaround time
Critical handoffs
- Booking to boarding
- Hotel operations to marine operations
- Ship to port and regulator
THE C1 REALITY LAYER
Advice at the moment you need it.
Past-cohort precedent is separated from current C2 instructions. Anything changeable remains marked C2 VERIFY.Prepare the conditions
Complete the cruise check-in before departure
C1 check-in involved ID upload, a live photograph, health declaration, boarding-pass generation, original ID at the terminal, a mandatory safety drill and a long arrival window.
- Screenshot the boarding pass.
- Keep original ID in the bag carried to the terminal.
- Check luggage wheels and handles.
- Leave both hands as free as possible for disembarkation.
Trace the operating system
Docking, guest release and onward transport are three clocks
C1’s cruise rhythm separated boarding formalities, safety drill, fixed sailing time, arrival and the actual start of disembarkation. Do not treat one timestamp as the whole journey.
C1 Cordelia itinerary and operations logTurn experience into evidence
The glamorous product ended at the gangway; the experience did not
After C1 disembarked, vehicle permissions, parking distance and luggage capacity broke the port-to-road handoff. Students moved bags over a long, busy approach road: a case in last-mile planning and service recovery.
C1 Ops group · 25 February 2026USEFUL WORDS
Speak the language without hiding behind it.
- Occupancy
- Share of available capacity sold.
- Yield
- Revenue per unit of capacity, including discounting.
- Onboard spend
- Purchases after the ticket.
- Turnaround
- Hours between one voyage ending and the next boarding.
Evidence boundary
Occupancy and spend heard onboard are Reported. Structural curves in the guide are illustrations, not company data.
Compare with Yotta, Glenburn and a service bay: unsold capacity disappears.
WATCH / READ / EXPLORE
THE EXACT DESIGNED PAGES