Café, retail and gifting customers.
Live route status · Lucknow · current hubYou’re reading · SMOOR / Bliss Chocolates
ORGANISATION FIELD BRIEF
FIELD EDITIONSMOOR / Bliss Chocolates
Premium chocolate manufacturing, cafés and gifting
SMOOR makes chocolate and desserts and sells them through its own cafés and gifting channels, linking production, forecasting and retail inside one business.
WHY THIS VISIT IS USEFUL
Its inventory can expire in hours, making demand forecasting and store execution inseparable from product quality.
WHAT IT CANNOT ESTABLISH
One facility or café cannot establish network-wide waste, gifting concentration or store profitability.THE SYSTEM MODEL
Who acts, who pays and who carries the downside?
Consumers; staff and ingredient suppliers participate in the chain.
Taste, location, gifting occasions and visual merchandising.
The company bears short shelf-life and store fixed-cost risk.
Ingredients → kitchen/factory → controlled storage → store or café → consumption.
Forecasts move down; sell-through, waste and temperature exceptions must move back.
Ingredients, labour and store rent are committed before date-sensitive demand arrives.
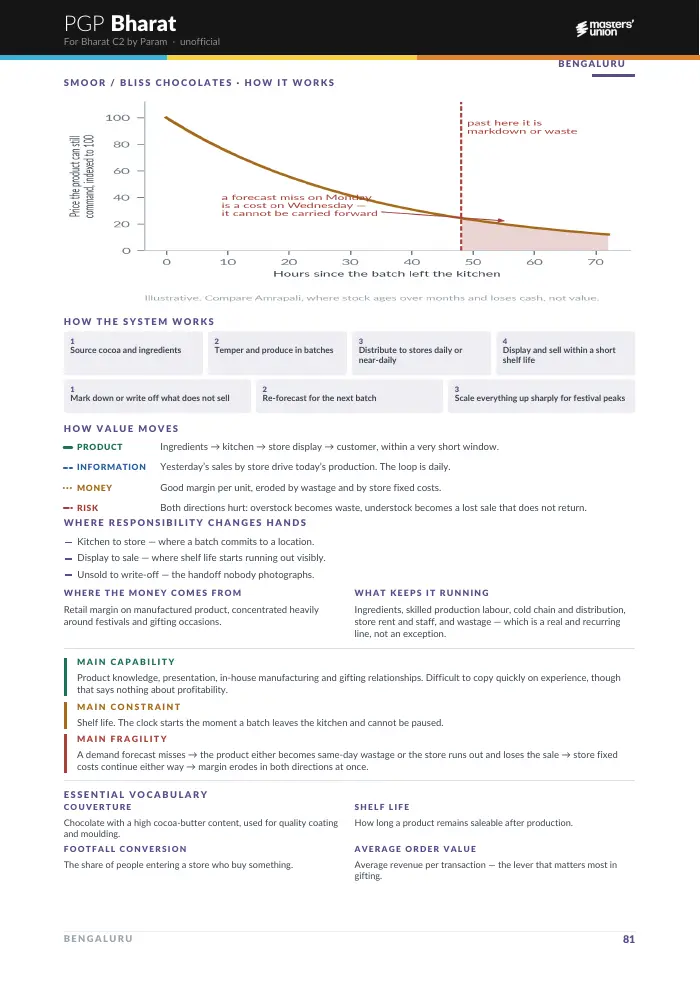
Quality and shelf life decay with time and temperature; unsold output can lose all value.
Product development, controlled production, brand and own-retail experience.
Forecasting demand inside a short freshness window.
Forecast misses → stock ages or sells out → waste or lost sales rise → store contribution weakens → expansion adds more fixed cost.
ON THE GROUND
Look for evidence—not presentation polish.
What to notice
- How production follows demand forecasts
- Where temperature and presentation are controlled
- Which items become same-day waste
Numbers that reveal the system
- Shelf-life waste
- Average order value
- Store footfall conversion
Critical handoffs
- Recipe to production
- Production to cold chain
- Distribution to store
- Display to customer
USEFUL WORDS
Speak the language without hiding behind it.
- Shelf life
- Time a product remains saleable at intended quality.
- Waste rate
- Share made but not sold.
- Sell-through
- Share of received inventory sold.
- Store contribution
- Store revenue after its direct variable and controllable costs.
Evidence boundary
Visible demand on one day cannot establish store economics, waste rate or chain-wide freshness performance.
Compare with Amrapali: one inventory ages for years, the other for hours.
WATCH / READ / EXPLORE
THE EXACT DESIGNED PAGES